The Allergy, Asthma, and Immunology Center of Alaska collects and reports data from two pollen counting stations. These stations are managed by Bryan Farthing DHSc, MS, PA-C who is nationally certified by the National Allergy Bureau in pollen counting along with his pollen “hunting” team (David Kingston PA-C, Sean Walsh PA-C and Cameron Rosen EMT). The AAIC currently only counts pollen grains, we are not currently counting mold spores.

It is a physical place where devices that collect pollen grains / fungal spores are used, and in the same place or in another place, where pollen grains are classified, counted, and report the daily and/or weekly results.
The Allergy, Asthma, and Immunology Center of Alaska manages two stations.
-
The AAIC Station, located on the roof of T-Tower at Providence in Anchorage Alaska (24-hour counts).
-
The King Street Station, located on the roof of King Street in Anchorage Alaska (7 days counts).
-
The King Street Burkard Trap is owned by Asthma and Allergy Foundation of America (Alaska Chapter) through a grant provided by the Rasmuson Foundation. The site is courtesy of King Street Brewery.
-
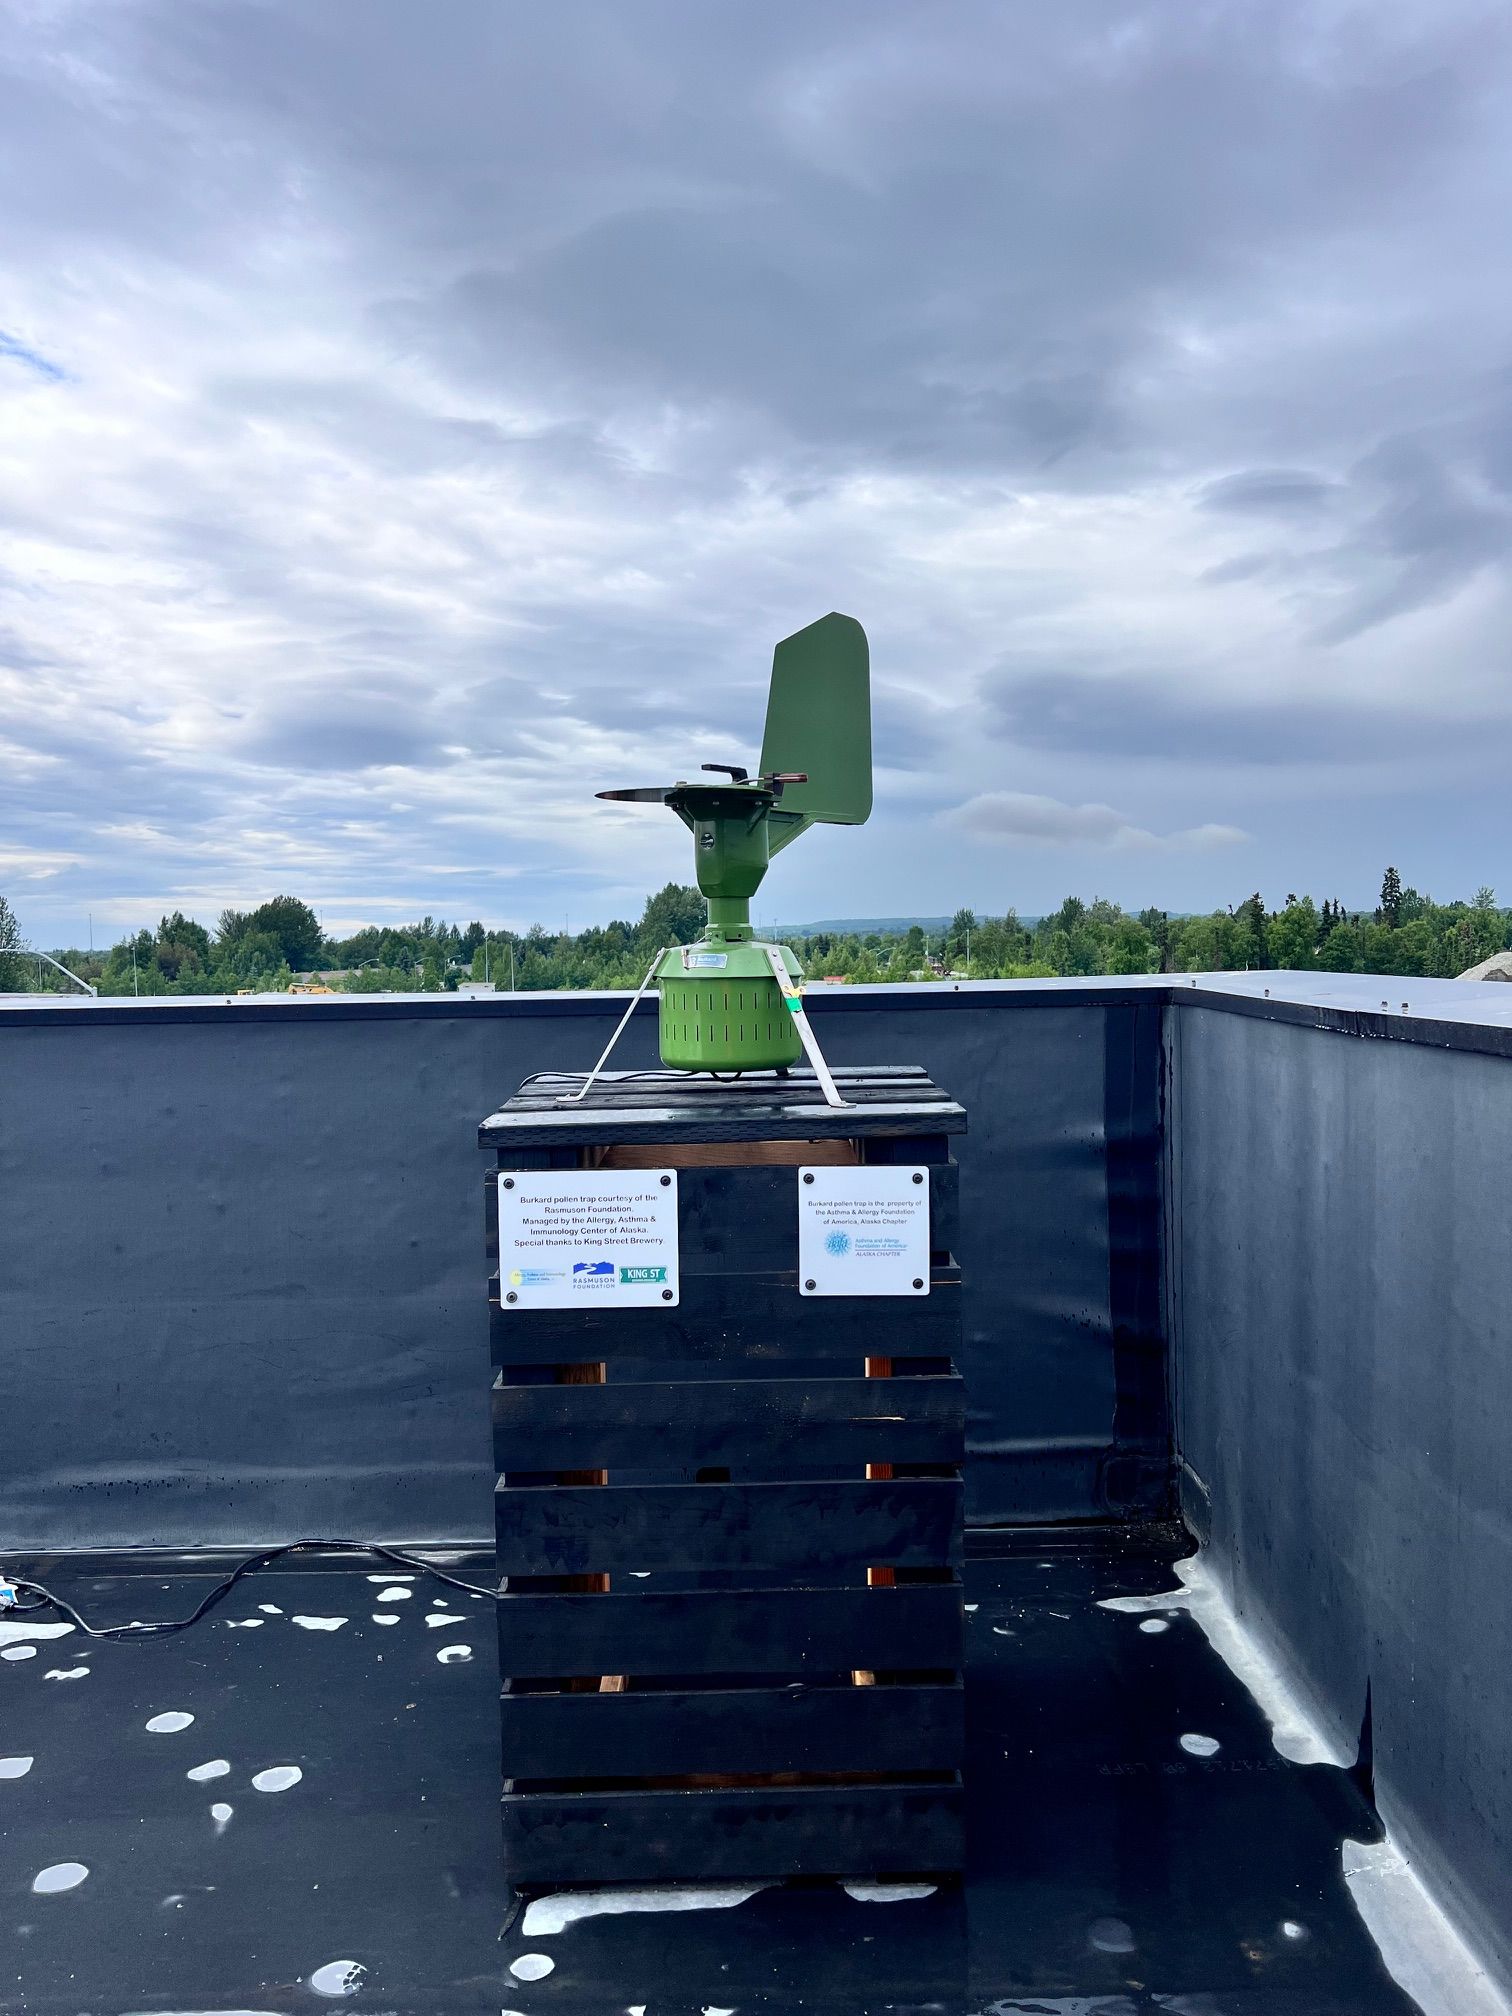
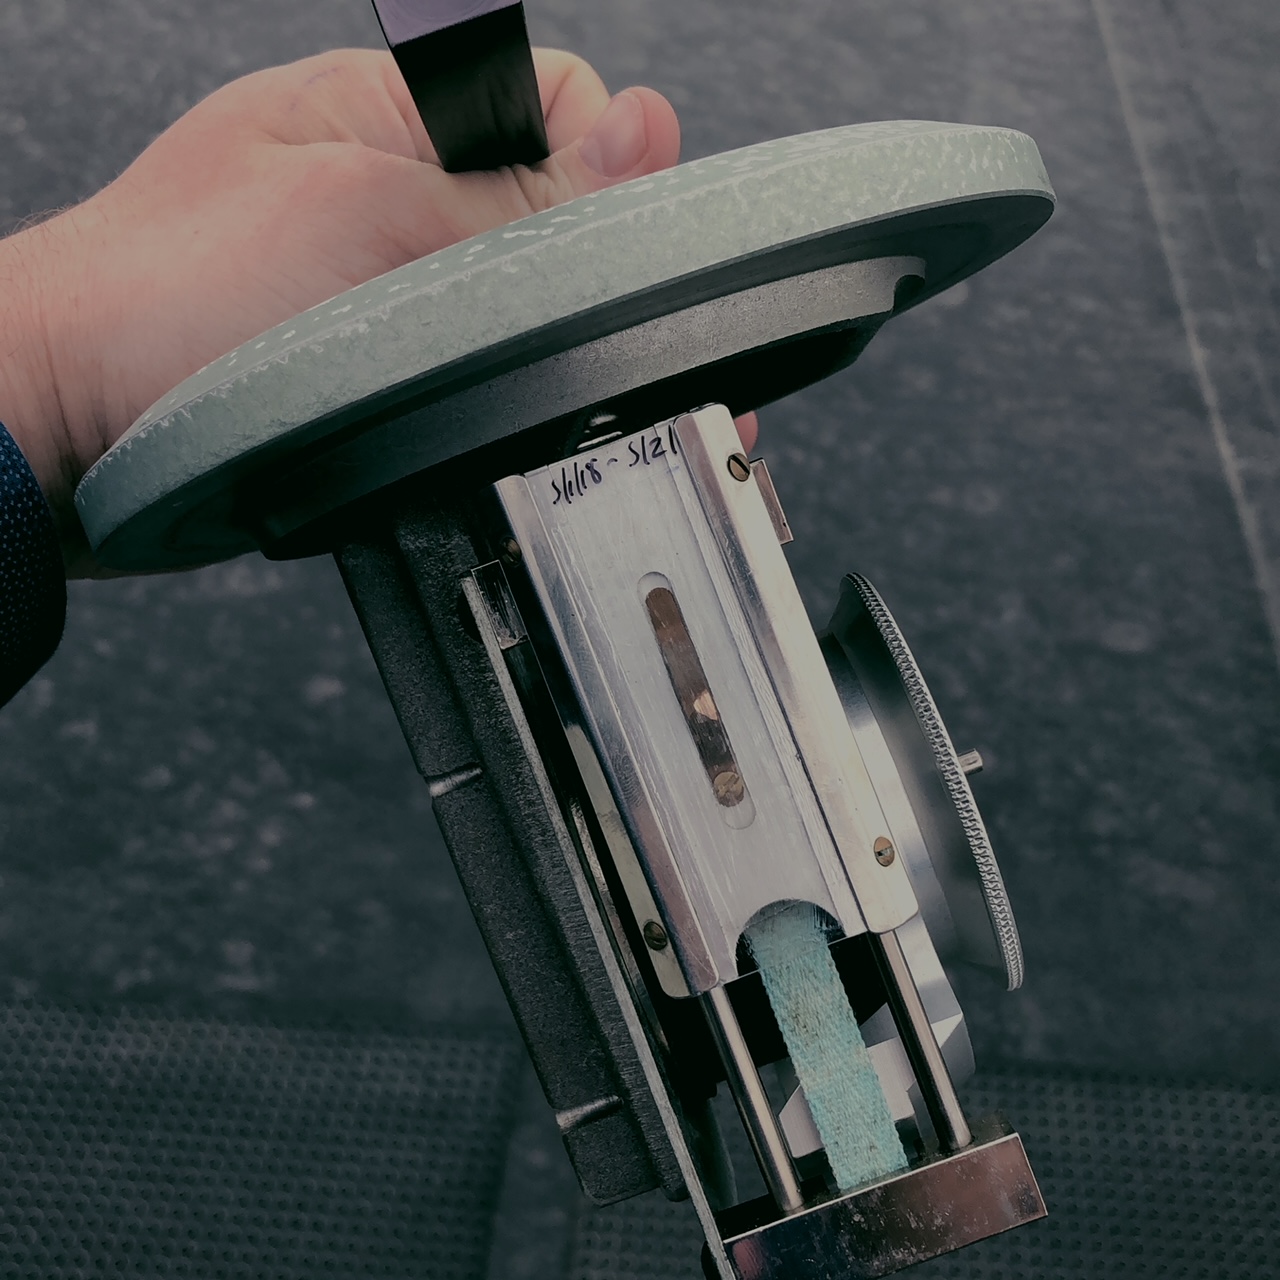
We use a Burkard Trap. Burkard Trap is a Volumetric Spore Trap A compact unit with built-in vacuum pump, designed to sample airborne particles such as fungus spores and pollens, continuously for periods of up to seven days without attention. Particles are impacted on adhesive coated transparent plastic tape supported on a clockwork-driven drum.
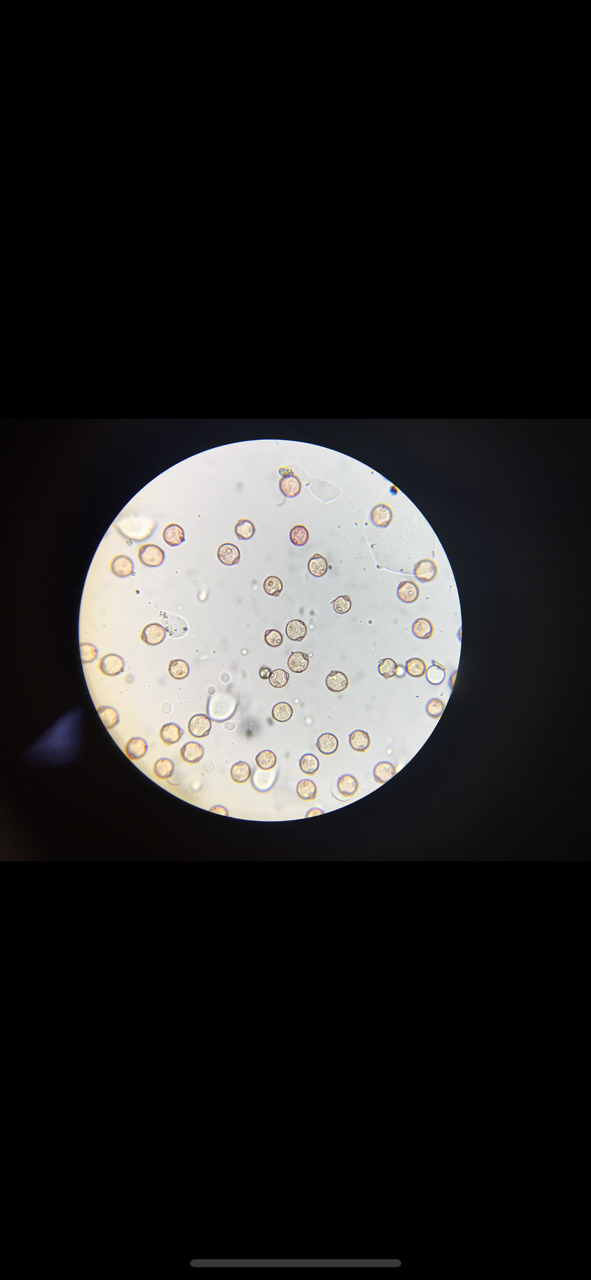
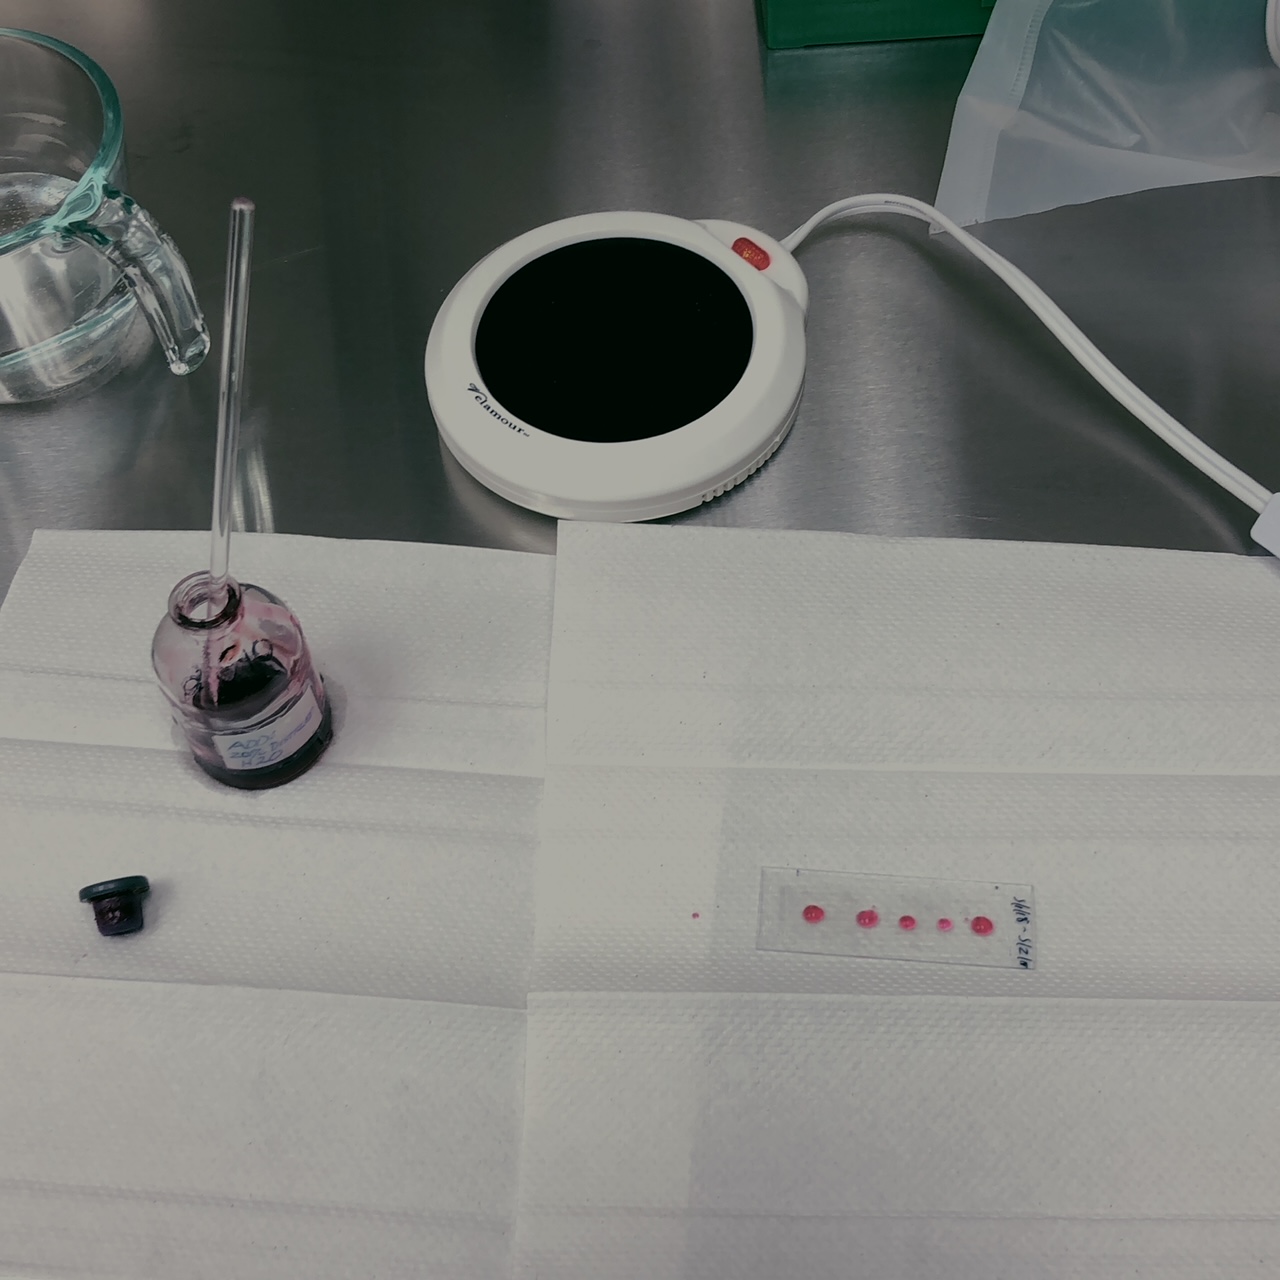
The pollen is then stained and reviewed under a microscope. After the grains of pollen are counted based on shape and size, a formula is used to determine how much pollen there is in the air at that time.
-
The AAIC Site counts 3 times per week posting 24 hour reads, usually from breakup until first freeze.
-
The King Street Site counts once per week, using a 7-day drum (the data posted will be from the previous 7 days), usually from breakup until first freeze.
Reading the Levels
The NAB pollen and mold spore levels were developed using the chart below. The concentrations in the chart (pollen or spores per cubic meter) were statistics from all certified counting sites. The levels correspond to different ranges for each of the pollen categories and for fungal spores. The concentrations were translated into levels based on the following:
-
Low levels are concentrations that are less than the median or 50th percentile (i.e. half the counts were below the median.)
-
Moderate levels are concentrations that fall between the 50th and 75th percentile
-
High levels fall between the 75th and 99th percentile
-
Very high levels are above the 99th percentile (99% of the counts are below this level)
Based on these definitions, we suggest the following ranges for low, moderate, high, and very high.
Other Reports
Molds:
0 – Absent (white)
1-6499 – Low (green)
6500-12999 – Moderate (yellow)
13000-49999 – High (orange)
> 50000 – very high (red)
Trees:
0-Absent (white)
1-14 – low (green)
15-89 – moderate (yellow)
90-1499 – high (orange)
>1500 – very high (red)
Grass:
0-absent (white)
1-4 – low (green)
5-19 – moderate (yellow)
20-199 – high (orange)
>200 – very high (red)
Weeds:
0 – absent (white)
1-9 – low (green)
10-49 – moderate (yellow)
50-499 – high (orange)
> 500 – very high (red)
